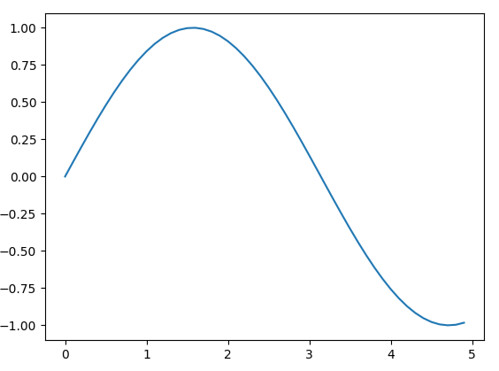
畫一個正弦波:
import numpy as np

import matplotlib.pyplot as plt


x = np.arange(0, 5, 0.1);

y = np.sin(x)

plt.plot(x, y)

plt.show()
其中 np.arange 的參數是 x 介於 0 ~ 5 ,並且以 0.1 間隔產生,所以真正產生的數字序列為:
[ 0.   0.1  0.2  0.3  0.4  0.5  0.6  0.7  0.8  0.9  1.   1.1  1.2  1.3  1.4

  1.5  1.6  1.7  1.8  1.9  2.   2.1  2.2  2.3  2.4  2.5  2.6  2.7  2.8  2.9

  3.   3.1  3.2  3.3  3.4  3.5  3.6  3.7  3.8  3.9  4.   4.1  4.2  4.3  4.4

  4.5  4.6  4.7  4.8  4.9]
接著,在定義 y 的數值是怎樣產生,就用 plt.plot 把它畫出跟展現出來。
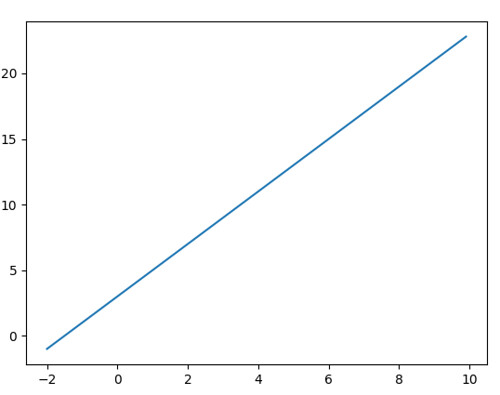
同理,簡單畫出個 y = 2x + 3, -2 <= x <= 10
import numpy as np

import matplotlib.pyplot as plt


x = np.arange(-2, 10, 0.1);

y = x * 2 + 3

plt.plot(x, y)


plt.show()
以上就快速明瞭畫圖的方式了,接著談談一張圖多個小圖,或是一口氣產生多個圖的方式。
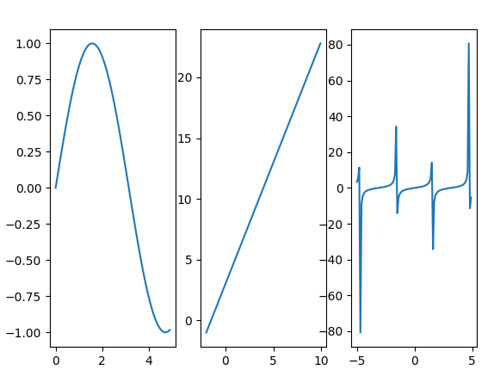
對於一張圖有多個小圖的部分,會使用到 plt.subplot ,他吃的參數有 3 欄,也有人喜歡給一個三個位數的整數給他:
plt.subplot( x, y, z ) 或 plt.subplot(xyz)
其中 x 代表 row,y 代表 column 而 z 代表 location (顯示位置)
例如,想要做出一張有三個小圖的圖表,就可以用 row=1, column=3,接著開始作畫:
import numpy as np

import matplotlib.pyplot as plt


# draw 1 picture

plt.subplot(1,3,1)


x = np.arange(0, 5, 0.1);

y = np.sin(x)

plt.plot(x, y)


# draw 2 picture

plt.subplot(1,3,2)


x = np.arange(-2, 10, 0.1);

y = x * 2 + 3

plt.plot(x, y)


# draw 3 picture

plt.subplot(1,3,3)


x = np.arange(-5, 5, 0.1)

y = np.tan(x)

plt.plot(x, y)


plt.show()
如何在程式內一次畫多張畫布,就是用 plt.figure 來處理了
import numpy as np

import matplotlib.pyplot as plt


# draw 1 picture

plt.figure(1)


x = np.arange(0, 5, 0.1);

y = np.sin(x)

plt.plot(x, y)


# draw 2 picture

plt.figure(2)


x = np.arange(-2, 10, 0.1);

y = x * 2 + 3

plt.plot(x, y)


# draw 3 picture

plt.figure(3)


x = np.arange(-5, 5, 0.1)

y = np.tan(x)

plt.plot(x, y)


plt.show()
結果就會產出三張圖。
最後,談談環境架設的部分,這次分別在 macOS 10.11 跟 macOS 10.12 嘗試過,兩邊都分別用 MacPorts 安裝 python 3.6 和 pip 套件,並從 XQuartz 網站下載視窗軟體。
連續動作:
1. 安裝 https://dl.bintray.com/xquartz/downloads/XQuartz-2.7.11.dmg 後重開機(很重要 XD)
2. 安裝 py36-pip py36-virtualenv 和 matplotlib 繪圖需要的函式庫 py36-tkinter
3. 使用 virtualenv 建置環境,並把缺的 py36-tkinter library 移入使用
4. 安裝 matplotlib、numpy 等常用工具
5. 收工,可以把玩繪圖了
$ sudo port install py36-pip py36-virtualenv py36-tkinter

$ virtualenv study

$ source study/bin/activate

$ cd study/lib/python3.6/site-packages

$ ln -s /opt/local/Library/Frameworks/Python.framework/Versions/3.6/lib/python3.6/site-packages/_tkinter.cpython-36m-darwin.so  .

$ cd -

$ vim ~/.matplotlib/matplotlibrc

backend: Tkagg

(study) $ pip install matplotlib

(study) $ python draw.py
錯誤處理:
import _tkinter # If this fails your Python may not be configured for Tk
ModuleNotFoundError: No module named '_tkinter'
$ sudo port install py36-tkinter

$ cd path-virtual-env-project/lib/python3.6/site-packages

$ ln -s /opt/local/Library/Frameworks/Python.framework/Versions/3.6/lib/python3.6/site-packages/_tkinter.cpython-36m-darwin.so  .
參考資料:
1. https://matplotlib.org/users/pyplot_tutorial.html
2. https://matplotlib.org/users/customizing.html
您好:我使用sudo port install py36-pip py36-virtualenv py36-tkinter指令後被要求輸入密碼
回覆刪除請問密碼是什麼呢?