看到以下訊息,完全摸不著頭緒:
[BoringSSL] nw_protocol_boringssl_input_finished(1543) [C294.1:2][0x11f2823d0] Peer disconnected during the middle of a handshake. Sending errSSLClosedNoNotify(-9816) alert

TIC TCP Conn Failed [294:0x2812a5a40]: 3:-9816 Err(-9816)

[BoringSSL] nw_protocol_boringssl_input_finished(1543) [C295.1:2][0x108589540] Peer disconnected during the middle of a handshake. Sending errSSLClosedNoNotify(-9816) alert

TIC TCP Conn Failed [295:0x2812d0540]: 3:-9816 Err(-9816)

[BoringSSL] boringssl_context_alert_callback_handler(3724) [C296.1:2][0x108450060] Alert level: fatal, description: inappropriate fallback

[BoringSSL] boringssl_session_errorlog(224) [C296.1:2][0x108450060] [boringssl_session_handshake_incomplete] SSL_ERROR_SSL(1): operation failed within the library

[BoringSSL] boringssl_session_handshake_error_print(205) [C296.1:2][0x108450060] 4838922792:error:1000043e:SSL routines:OPENSSL_internal:TLSV1_ALERT_INAPPROPRIATE_FALLBACK:/BuildRoot/Library/Caches/com.apple.xbs/Sources/boringssl/boringssl-109.230.1/ssl/tls_record.cc:586:SSL alert number 86

[BoringSSL] boringssl_context_get_error_code(3617) [C296.1:2][0x108450060] SSL_AD_INAPPROPRIATE_FALLBACK

TIC TCP Conn Failed [296:0x2812d0a80]: 3:-9860 Err(-9860)

NSURLSession/NSURLConnection HTTP load failed (kCFStreamErrorDomainSSL, -9860)

Task <FAB06FFC-73C2-48D8-AAEA-750F2FCF1969>.<0> HTTP load failed (error code: -1200 [3:-9860])

NSURLConnection finished with error - code -1200
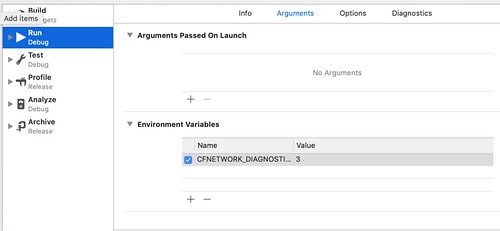
最後拜讀 StackOverflow - XCode 9 iOS 11 BoringSSL SSL_ERROR_ZERO_RETURN 可以定義 CFNETWORK_DIAGNOSTICS = 3 數值來 debug,並透過 Xcode's scheme 管理環境變數即可,收工!
