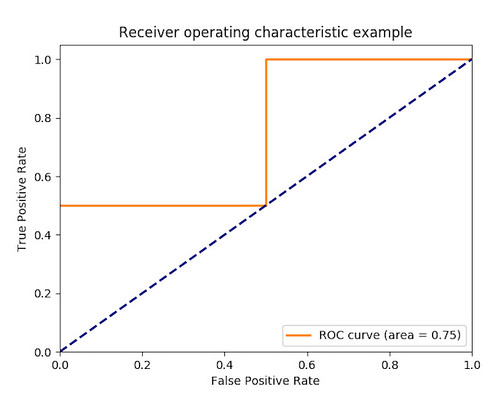
最近回想起兩年前走跳過的一場黑客松,當年的題目恰好是一個屬性的分類,就是一篇文章屬性給你,請告訴我它是不是 spam!所幸網路上還可以看到其他人的作品,逛了一下也順便研究別人的報告怎麼寫,其中有一組使用了 ROC 曲線來回報自己的分析成果,就來多多認識一下。
而 ROC 曲線是什麼?其實在 WIKI 或是 scikit-learn 文件(也引用WIKI資料)有很明確地解釋:
- https://zh.wikipedia.org/wiki/ROC%E6%9B%B2%E7%BA%BF
- http://scikit-learn.org/stable/modules/model_evaluation.html#receiver-operating-characteristic-roc
因此,只需設法把模型預測結果畫一下 ROC 曲線,在算出個面積,就收工啦!
範例請參考 http://scikit-learn.org/stable/auto_examples/model_selection/plot_roc.html ,在此只筆記畫圖的部分:
import numpy as np

from sklearn.metrics import roc_curve, auc

y = np.array([0, 0, 1, 1])

scores = np.array([0.1, 0.4, 0.35, 0.8])

fpr, tpr, _ = roc_curve(y, scores)

roc_auc = auc(fpr, tpr)


import matplotlib as mpl

#mpl.use('Agg')

import matplotlib.pyplot as plt


fig = plt.figure()

lw = 2

plt.plot(fpr, tpr, color='darkorange', lw=lw, label='ROC curve (area = %0.2f)' % roc_auc)

plt.plot([0, 1], [0, 1], color='navy', lw=lw, linestyle='--')

plt.xlim([0.0, 1.0])

plt.ylim([0.0, 1.05])

plt.xlabel('False Positive Rate')

plt.ylabel('True Positive Rate')

plt.title('Receiver operating characteristic example')

plt.legend(loc="lower right")

#fig.savefig('/tmp/roc.png')

plt.show()
沒有留言:
張貼留言